
This article addresses the challenge of develop a process to create a database with demographic information, which serves as a starting point for creating a data model in PowerPivot, used in the construction of the population pyramid shown in Population pyramids with PowerPivot. Preparing the data and Population pyramids with PowerPivot. Chart development.
Unlike the article «Generate SQL Server test data from Excel» (part 1 and part 2) also published in this blog, where we used Excel to generate dummy data population, this time we will work with real data, which represent a larger volume of information to manage with respect the above-mentioned article.
The current aim is to create a database containing a population table, in which each record represents an individual, with its corresponding age, sex and healthcare area.
Before proceeding, I want to express my gratitude to Ricard Gènova Maleras, demographer specializing in population health analysis, member of the Health Service Reports and Studies (Directorate of Health Promotion and Prevention, DG Primary Care, Health Ministry CM) for their valuable advice in those key demographics for the development of this and the all related population pyramids published in this blog. Equally, I want to thank to the rest members of that Service: Jenaro Astray Mochales, Felicitas Dominguez Berjón and María Dolores Esteban Vasallo, for their support and assistance in all health concepts about population necessary for the proper focus of this article.
Last but not least, thanks to Enrique Barceló, technical fellow in the BI team, for their support and advise about matters relating to the OLAP data cubes development.
Data collection and preparation
There are several Web sites belonging to different agencies, where we will find demographic information needed to perform our analysis, organized by criteria such as sex, age, geographic region, etc. Of all these agencies to highlight the relevant United Nations , National Statistical Institute (Spain), Institute of Statistics of the CAM (Madrid) and CELADE (demographics of Latin America and Caribbean). In all cases, in addition to direct consultation in the website, we have the ability to download information in various formats such as Excel, CSV, etc.
For the development of the examples in this article we’ll use the registered population data from the Community of Madrid for the year 2010, classified by age, sex and health zoning, effective as of that year, found in the following link (T10Z2_SALUD10) from the website of the Statistical Institute of CAM.
Data extraction strategy
The Excel file pc10t10z2_salud10.xls obtained from the above link, organizes the data of population around three worksheets containing respectively, the values of total population, men and women.
Each worksheet has in its first two columns the code and name of the health care area, while the remaining columns contain population figures classified in five-year groups, where each group has a column with the total five-year and several columns representing the detail by simple age of the ages that make up the group.
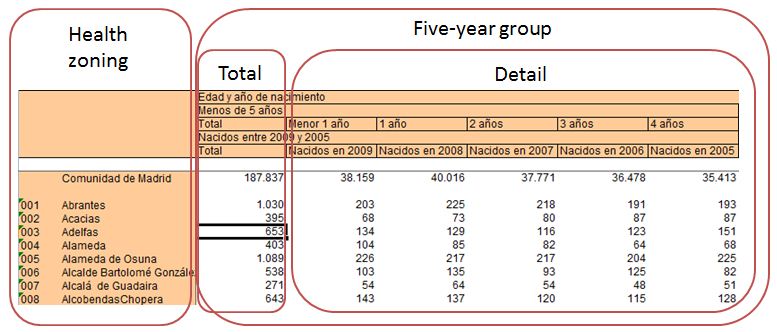
The data we need extract are, first, the codes and names of health zoning, for which we can use any of the worksheets in the Excel file. Moreover, we have to get the total five-year age group in both sheets: male and female population.
We will bring all these values to a new worksheet in which we copy each combination of health area codes, age group and population type (male / female) in order of steps similar to the following figure.
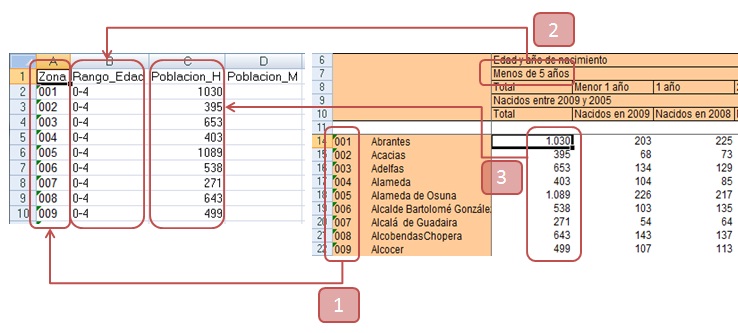
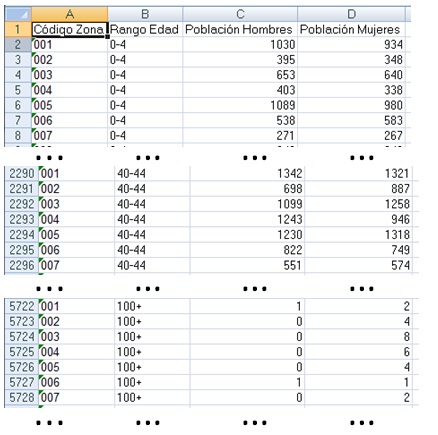
Here we see an approximation of what would be the resulting spreadsheet.
Using select, copy and paste operations by hand to transfer the needed data to a new sheet can be a cumbersome and heavy task. That is why we propose to use a macro that automates all this work, allowing us to repeat the process as many times as we want, and apply it to other populations whose data is structured the same way.
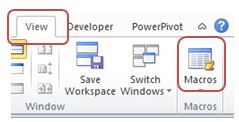
To create the macro, on the Excel Ribbon will click on the «Macros» option, belonging to the same name group, located on the «View» tab.
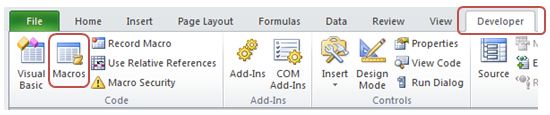
This option is also available on the «Developer» tab, within «Code» group.
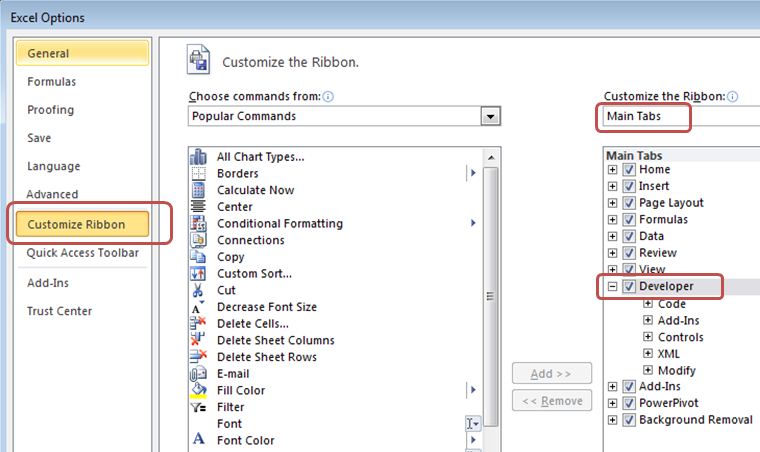
In the event that the «Developer» tab is not visible, we will click on the «File» tab, and within this on «Options». In «Excel Options» window will click «Customize Ribbon» and displaying the list on the right select the item «Main Tabs». In the panel below the list will check «Developer», which will make this tab visible in the ribbon.
Regardless the way chosen for its creation, the «Macro» window will appear, we’ll give the name «TraspasarDatosPoblacion» to our macro and click «Create», which will lead to the VBA (Visual Basic for Applications) editor, where we write the code for the macro.
We will divide the work to carry out the macro into three parts: data creation for health area code column, age range column, and finally, the columns of numbers of population by sex.
In the next block of code we can see the instructions responsible of creating a new worksheet, which assign a name and column headings. Later we’ll select the area codes from a source worksheet, which will paste in the new sheet many times as there age ranges.
Option Explicit
Private Const RANGOS_COLUMNAS As Integer = 20

Sub TraspasarDatosPoblacion()

' create new sheet and assign name
Dim sHojaDestino As String
sHojaDestino = "DatosBasePoblacion"

Dim oWorksheet As Worksheet
Set oWorksheet = Sheets.Add(After:=Sheets(Sheets.Count))
oWorksheet.Name = sHojaDestino

' assign column titles
Range("A1").Select
ActiveCell.FormulaR1C1 = "Zona"
Range("B1").Select
ActiveCell.FormulaR1C1 = "Rango_Edad"
Range("C1").Select
ActiveCell.FormulaR1C1 = "Poblacion_H"
Range("D1").Select
ActiveCell.FormulaR1C1 = "Poblacion_M"

' back to source data sheet
Sheets("Hombres").Select

' set start and end data rows
Dim sFilaInicial As String
Dim sFilaFinal As String
sFilaInicial = "14"
sFilaFinal = "299"

' calculate number of existing zones
Dim nCantidadZonas As Integer
nCantidadZonas = (CInt(sFilaFinal) - CInt(sFilaInicial))

' zone codes
' ----------
Dim sColumna As String
sColumna = "A"

' select codes, copy to clipboard and paste in a new sheet
Range(sColumna & sFilaInicial & ":" & sColumna & sFilaFinal).Select
Selection.Copy
Sheets(sHojaDestino).Select

Dim nContador As Integer
Dim nFilaVacia As Long

' do paste for each age group
For nContador = 0 To RANGOS_COLUMNAS
  ' obtain next empty row number from column
  nFilaVacia = FilaVaciaEnColumna(1)

  ' place in cell
  Range(sColumna & CStr(nFilaVacia)).Select

  ' paste data
  ActiveSheet.Paste
Next

' assign white color background to column
Columns("A:A").Select
Selection.Interior.Pattern = xlNone
Selection.Interior.TintAndShade = 0
Selection.Interior.PatternTintAndShade = 0
Before each assignment of values in cells, we need to know the empty row from which paste the data. For this, we’ll use the auxiliary function «FilaVaciaEnColumna» to iterate the collection of rows in the sheet to find the row containing an empty cell in that column on which we are working.
Function FilaVaciaEnColumna(ByVal nPosicionCelda As Integer) As Long
Dim vFila As Variant
Dim nFila As Long

For Each vFila In ActiveSheet.Rows
  nFila = vFila.Row

  If vFila.Cells(nPosicionCelda).Text = "" Then
    Exit For
  End If
Next

FilaVaciaEnColumna = nFila

End Function
The next phase in creating the macro will be to assign values to the column age ranges. So we’ll create an array containing these values, and to cross it, in each iteration, the current range value will be copied the same number of times than the amount of existing health zones. Note that before assigning values to this column we will apply the text format (property Selection.NumberFormat), since otherwise, the default format may cause some values of the age ranges are interpreted as month-year.
' age ranges
' --------------
Dim aRangosEdad(RANGOS_COLUMNAS) As String
aRangosEdad(0) = "0-4"
aRangosEdad(1) = "5-9"
aRangosEdad(2) = "10-14"
aRangosEdad(3) = "15-19"
aRangosEdad(4) = "20-24"
aRangosEdad(5) = "25-29"
aRangosEdad(6) = "30-34"
aRangosEdad(7) = "35-39"
aRangosEdad(8) = "40-44"
aRangosEdad(9) = "45-49"
aRangosEdad(10) = "50-54"
aRangosEdad(11) = "55-59"
aRangosEdad(12) = "60-64"
aRangosEdad(13) = "65-69"
aRangosEdad(14) = "70-74"
aRangosEdad(15) = "75-79"
aRangosEdad(16) = "80-84"
aRangosEdad(17) = "85-89"
aRangosEdad(18) = "90-94"
aRangosEdad(19) = "95-99"
aRangosEdad(20) = "100+"

' assign format of age column to text
sColumna = "B"
Columns(sColumna & ":" & sColumna).Select
Selection.NumberFormat = "@"

' repeat each value of aRangosEdad array
' as times as number of existing zones
Dim vRangoEdad As Variant

For Each vRangoEdad In aRangosEdad
  ' obtain next empty row number from column
  nFilaVacia = FilaVaciaEnColumna(2)

  ' assign age range value in next two cells down
  Range(sColumna & CStr(nFilaVacia)).Select
  ActiveCell.FormulaR1C1 = vRangoEdad

  Range(sColumna & CStr(nFilaVacia + 1)).Select
  ActiveCell.FormulaR1C1 = vRangoEdad

  ' set cell range and fill with value of above cells
  Range(sColumna & CStr(nFilaVacia) & ":" & sColumna & CStr(nFilaVacia + 1)).Select
  Selection.AutoFill Destination:=Range(sColumna & CStr(nFilaVacia) & ":" & sColumna & CStr(nFilaVacia + nCantidadZonas)), Type:=xlFillDefault
Next
And we end the macro with the assignment of the columns dedicated to the population figures by sex, where this time use two combined arrays containing the column headings that correspond to the five-year total population and population type. When touring both in a nested way, for a certain type of population, we’ll extract their numbers of individuals, assigning them to the destination worksheet.
' population figures by sex
' ----------------------------
Dim aColumnasPoblacion(RANGOS_COLUMNAS) As String
aColumnasPoblacion(0) = "D"
aColumnasPoblacion(1) = "J"
aColumnasPoblacion(2) = "P"
aColumnasPoblacion(3) = "V"
aColumnasPoblacion(4) = "AB"
aColumnasPoblacion(5) = "AH"
aColumnasPoblacion(6) = "AN"
aColumnasPoblacion(7) = "AT"
aColumnasPoblacion(8) = "AZ"
aColumnasPoblacion(9) = "BF"
aColumnasPoblacion(10) = "BL"
aColumnasPoblacion(11) = "BR"
aColumnasPoblacion(12) = "BX"
aColumnasPoblacion(13) = "CD"
aColumnasPoblacion(14) = "CJ"
aColumnasPoblacion(15) = "CP"
aColumnasPoblacion(16) = "CV"
aColumnasPoblacion(17) = "DB"
aColumnasPoblacion(18) = "DH"
aColumnasPoblacion(19) = "DN"
aColumnasPoblacion(20) = "DT"

Dim aTiposPoblacionColumnas(1) As String
aTiposPoblacionColumnas(0) = "Hombres,C,3"
aTiposPoblacionColumnas(1) = "Mujeres,D,4"

Dim vTipoPoblacionColumna As Variant
Dim sTipoPoblacion As String
Dim nPosicionColumna As Integer
Dim vColumnaPoblacion As Variant

' for each population type
For Each vTipoPoblacionColumna In aTiposPoblacionColumnas
  ' obtain information of population type:
  ' sex, target column, numeric position in target column
  sTipoPoblacion = Split(vTipoPoblacionColumna, ",")(0)
  sColumna = Split(vTipoPoblacionColumna, ",")(1)
  nPosicionColumna = Split(vTipoPoblacionColumna, ",")(2)

  ' iterate the columns with population figures
  ' and paste in new sheet
  For Each vColumnaPoblacion In aColumnasPoblacion
    ' place in sheet with source population data
    Sheets(sTipoPoblacion).Select

    ' select and copy cells
    Range(vColumnaPoblacion & sFilaInicial & ":" & vColumnaPoblacion & sFilaFinal).Select
    Selection.Copy

    ' place in target sheet
    Sheets(sHojaDestino).Select

    ' obtain next empty row, place in cell and paste data
    nFilaVacia = FilaVaciaEnColumna(nPosicionColumna)
    Range(sColumna & CStr(nFilaVacia)).Select
    ActiveSheet.Paste
  Next
Next

' change column style to display cell borders
Columns("C:D").Select
Selection.Style = "Normal"

Range("A1").Select

End Sub
Then create a new macro with the name «TraspasarDatosZonificacion» whereby we’ll move to a new worksheet codes and names of the healthcare areas. These data will be used to load a table in the database we’ll create later.
Sub TraspasarDatosZonificacion()
' create new sheet and assign name
Dim sHojaDestino As String
sHojaDestino = "DatosZonificacion"

Dim oWorksheet As Worksheet
Set oWorksheet = Sheets.Add(After:=Sheets(Sheets.Count))
oWorksheet.Name = sHojaDestino

' set column titles
Range("A1").Select
ActiveCell.FormulaR1C1 = "Zona_ID"
Range("B1").Select
ActiveCell.FormulaR1C1 = "Zona_DS"

' back to data sheet
Sheets("Hombres").Select

' copy zone codes and names to clipboard
Range("A14:B299").Select
Selection.Copy

' back to target sheet and paste data
Sheets(sHojaDestino).Select
Range("A2").Select
ActiveSheet.Paste

' remove cell background color
Columns("A:B").Select
Selection.Interior.Pattern = xlNone
Selection.Interior.TintAndShade = 0
Selection.Interior.PatternTintAndShade = 0

Range("A1").Select

End Sub
When we copy the codes and names of the health zones to new sheets within the Excel file, the color configuration of the cells corresponding to these values is copied too. To achieve white background color in these cells, we use the following lines of code.
Selection.Interior.TintAndShade = 0
Selection.Interior.PatternTintAndShade = 0
But if our version of Excel is prior to 2007 these lines will fail at runtime, so we must comment them to avoid being executed.
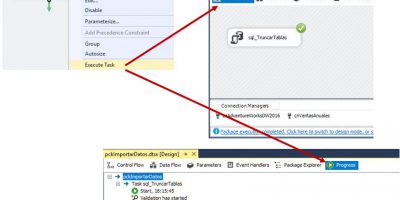
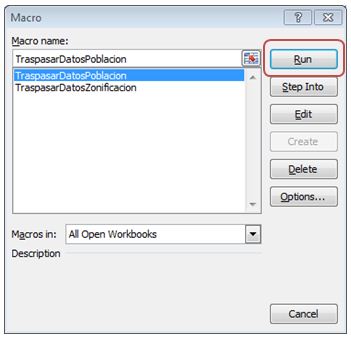
Finally, from the macro management window, we’ll select each one and click on «Run».
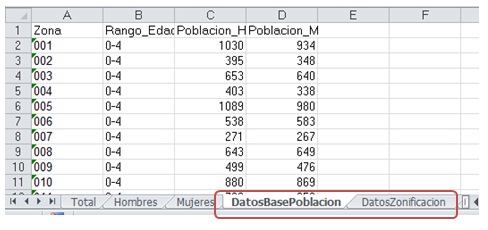
As a result we will obtain two new sheets with the data generated by the macros.
Database creation
Our next step is to create the database PiramidePoblacion, to accommodate the information we have just prepared in Excel. The following code block shows the Transact-SQL script that will be executed in our SQL Server instance (in this article we have used SQL Server 2008 R2).
CREATE DATABASE PiramidePoblacion
GO
USE PiramidePoblacion
GO

CREATE TABLE DatosBasePoblacion
(
Fila_ID int IDENTITY(1,1) NOT NULL,
Zona varchar(3) NULL,
Rango_Edad varchar(10) NULL,
Poblacion_H int NULL,
Poblacion_M int NULL
)
GO

CREATE TABLE Poblacion
(
Fila_ID int IDENTITY(1,1) NOT NULL,
Zona_ID varchar(3) NULL,
Edad_ID int NULL,
Sexo_ID char(1) NULL,
CONSTRAINT PK_Poblacion PRIMARY KEY CLUSTERED (Fila_ID ASC)
)
GO

CREATE TABLE Zona
(
Zona_ID varchar(3) NOT NULL,
Zona_DS varchar(30) NULL,
CONSTRAINT PK_Zona PRIMARY KEY CLUSTERED (Zona_ID ASC)
)
GO

CREATE TABLE Edad
(
Edad_ID int NOT NULL,
Edad_Grupo varchar(20) NULL,
CONSTRAINT PK_Edad PRIMARY KEY CLUSTERED (Edad_ID ASC)
)
GO

CREATE TABLE Sexo
(
Sexo_ID char(1) NOT NULL,
Sexo_DS varchar(10) NULL,
CONSTRAINT PK_Sexo PRIMARY KEY CLUSTERED (Sexo_ID ASC)
)
GO
The table Poblacion will contain the main data of our population, while tables Zona, Edad and Sexo contain catalog information (code / descriptor).
Surely, in the script we will have noticed the lack of foreign keys between Poblacion table and the rest. This is an intentional forgetting that we’ll fix in the articles Population pyramids with PowerPivot. Preparing the data and Population pyramids with PowerPivot. Chart development, where we demonstrate how using PowerPivot we can also create relationships between tables in the model.
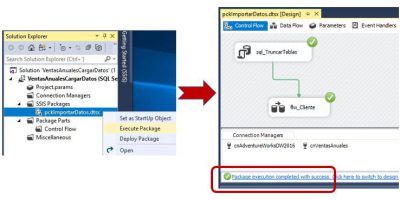
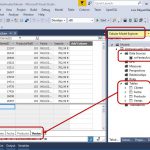
After running the script, the first action that will take place in the new database will be transfer data from sheet DatosBasePoblacion of file pc10t10z2_salud10.xls into the table of the same name, using the following statement.
INSERT INTO DatosBasePoblacion
SELECT * FROM OPENROWSET('Microsoft.ACE.OLEDB.12.0',
'Excel 8.0;Database=C:DatosOrigenpc10t10z2_salud10.xls',
'SELECT * FROM [DatosBasePoblacion$]')
Generating population records in the database
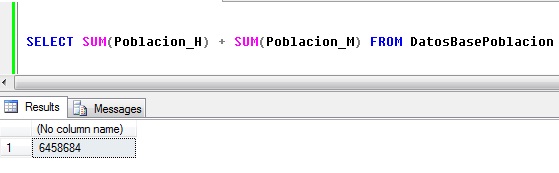
The purpose of the process that we are doing so far is to generate, for table Poblacion, a number of records that represent the population with which we work, and that will equal the sum of columns Poblacion_H and Poblacion_M from table DatosBasePoblacion.
For this volume of data, using a loop to create one by one the records is totally unfeasible due to time and performance reasons, so we must find an alternative technique that allows us to work using sets of results, to create the necessary number of records, using a small number of operations.
The technique that we will opt is shown in the book Microsoft SQL Server 2008: T-SQL Querying , by Itzik Ben-Gan and other great names in SQL Server: Lubor Kollar, Dejan Sarka and Steve Kass; and is use several «Common Table Expressions» or CTE nested, through which generate a result set of appropiate size, that we will combine with an INSERT INTO statement, to add to Poblacion table a determined number of records. All this will include in the following stored procedure.
CREATE PROCEDURE GenerarRegistrosPoblacion
@nZona_ID AS int,
@sRango_Edad AS varchar(10),
@sSexo_ID AS char(1),
@nPoblacion AS int
AS
BEGIN
DECLARE @nEdad_ID AS int =
CASE
  WHEN CHARINDEX('-',@sRango_Edad) = 0 THEN 100
  WHEN CHARINDEX('-',@sRango_Edad) = 2 THEN CAST(LEFT(@sRango_Edad,1) AS int)
  WHEN CHARINDEX('-',@sRango_Edad) = 3 THEN CAST(LEFT(@sRango_Edad,2) AS int)
END;

WITH
Numeros0 AS (SELECT 1 AS Numero UNION ALL SELECT 1),
Numeros1 AS (SELECT 1 AS Numero FROM Numeros0 AS TblPrim CROSS JOIN Numeros0 AS TblSeg),
Numeros2 AS (SELECT 1 AS Numero FROM Numeros1 AS TblPrim CROSS JOIN Numeros1 AS TblSeg),
Numeros3 AS (SELECT 1 AS Numero FROM Numeros2 AS TblPrim CROSS JOIN Numeros2 AS TblSeg),
Numeros4 AS (SELECT 1 AS Numero FROM Numeros3 AS TblPrim CROSS JOIN Numeros3 AS TblSeg),
Numeros5 AS (SELECT 1 AS Numero FROM Numeros4 AS TblPrim CROSS JOIN Numeros4 AS TblSeg),
NumerosTotal AS (SELECT ROW_NUMBER() OVER(ORDER BY (SELECT 0)) AS NumeroFila FROM Numeros5)
INSERT INTO Poblacion
SELECT @nZona_ID, @nEdad_ID, @sSexo_ID
FROM NumerosTotal
WHERE NumeroFila <= @nPoblacion;

END

GO
Then write a script which will cross the DatosBasePoblacion table, and each of their records will take the value of Poblacion_H and Poblacion_M fields, inserting in Poblacion table, by executing the stored procedure GenerarRegistrosPoblacion, a number of rows equal to value of the aforementioned fields.
DECLARE @nContador AS int = 1;
DECLARE @nDatosBaseFilaFinal AS int = (SELECT MAX(Fila_ID) FROM DatosBasePoblacion);
DECLARE @nZona AS int;
DECLARE @sRango_Edad AS varchar(10);
DECLARE @nPoblacion_H AS int;
DECLARE @nPoblacion_M AS int;
WHILE (@nContador <= @nDatosBaseFilaFinal)
BEGIN
SELECT @nZona = Zona,
@sRango_Edad = Rango_Edad,
@nPoblacion_H = Poblacion_H,
@nPoblacion_M = Poblacion_M
FROM DatosBasePiramidePoblacion
WHERE Fila_ID = @nContador;

EXECUTE GenerarRegistrosPoblacion @nZona, @sRango_Edad, 'H',@nPoblacion_H
EXECUTE GenerarRegistrosPoblacion @nZona, @sRango_Edad, 'M',@nPoblacion_M

SET @nContador += 1
END
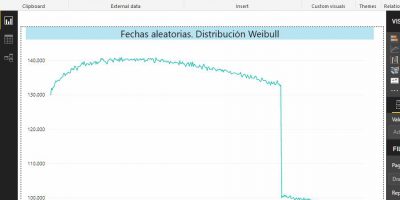
The time spent in the execution of this script was 1 minute and 37 seconds in a virtual machine equipped with a Core 2 Duo CPU and 1.5 GB of RAM, which represents excellent performance given the large number of records added to Poblacion table.
We ended the preparing database operations with the statements used to add data in tables that serve as catalogs for the table Poblacion. As we see below, for the Zona table we also get the records from pc10t10z2_salud10.xls file.
--////
INSERT INTO Zona
SELECT * FROM OPENROWSET('Microsoft.ACE.OLEDB.12.0',
'Excel 8.0;Database=C:DatosOrigenpc10t10z2_salud10.xls',
'SELECT * FROM [DatosZonificacion$]')
--////
DECLARE @nContador AS int = 0;
WHILE (@nContador <= 120)
BEGIN
INSERT INTO Edad
SELECT @nContador,
CASE
  WHEN @nContador BETWEEN 0 AND 4 THEN '000-004'
  WHEN @nContador BETWEEN 5 AND 9 THEN '005-009'
  WHEN @nContador BETWEEN 10 AND 14 THEN '010-014'
  WHEN @nContador BETWEEN 15 AND 19 THEN '015-019'
  WHEN @nContador BETWEEN 20 AND 24 THEN '020-024'
  WHEN @nContador BETWEEN 25 AND 29 THEN '025-029'
  WHEN @nContador BETWEEN 30 AND 34 THEN '030-034'
  WHEN @nContador BETWEEN 35 AND 39 THEN '035-039'
  WHEN @nContador BETWEEN 40 AND 44 THEN '040-044'
  WHEN @nContador BETWEEN 45 AND 49 THEN '045-049'
  WHEN @nContador BETWEEN 50 AND 54 THEN '050-054'
  WHEN @nContador BETWEEN 55 AND 59 THEN '055-059'
  WHEN @nContador BETWEEN 60 AND 64 THEN '060-064'
  WHEN @nContador BETWEEN 65 AND 69 THEN '065-069'
  WHEN @nContador BETWEEN 70 AND 74 THEN '070-074'
  WHEN @nContador BETWEEN 75 AND 79 THEN '075-079'
  WHEN @nContador BETWEEN 80 AND 84 THEN '080-084'
  WHEN @nContador BETWEEN 85 AND 89 THEN '085-089'
  WHEN @nContador BETWEEN 90 AND 94 THEN '090-094'
  WHEN @nContador BETWEEN 95 AND 99 THEN '095-099'
  WHEN @nContador >= 100 THEN '100+'
END

SET @nContador += 1;
END

--////
INSERT INTO Sexo VALUES ('H','Hombre')
INSERT INTO Sexo VALUES ('M','Mujer')
Data loading completed
At this point we conclude the process of creation and loading of demographic information in our database. In the articles pointed out at the beginning, we will use this database as a starting point for the construction of population pyramids with PowerPivot.


Deja un comentario