
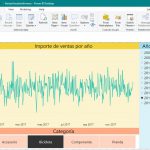
In the articles that were dedicated to the creation of a population pyramid using PowerPivot (part1 and part2), we saw the power that this add-on for Excel provides to users responsible for conducting information analysis on a database of demographic content.
Continuing the line of work depicted in those articles, this time we will address the development of superposed population pyramids, one aspect of the work with population pyramids, which is to observe and analyze the differences by sex and age structure between two populations by direct comparison of their respective pyramids.
Before proceeding I want to reiterate my thanks to Ricard Gènova Maleras, a demographer specializing in population health analysis, belonging to the Reports and Studies Health Service (Directorate of Health Promotion and Prevention, DG Primary Care, Health Ministry CM) for their invaluable review work and guidance on all those concepts about creating population pyramids, which have proved so valuable in the development of this and previous articles we have published about this topic in the blog.
Brief introduction to the superposed population pyramids
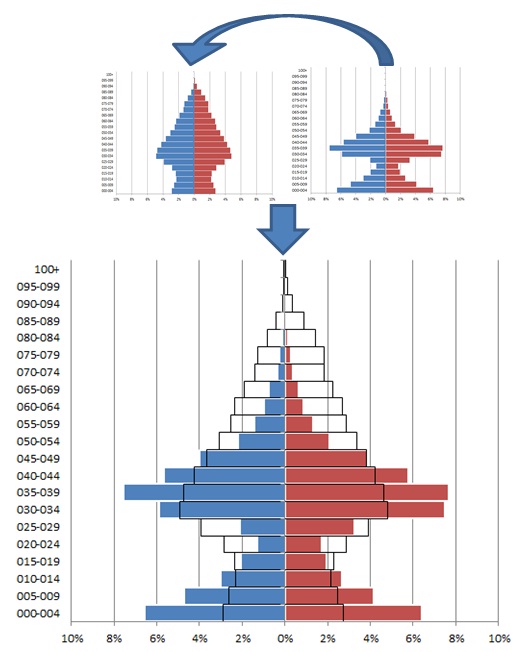
If we want to graphically describe this working scenario, firstly, we take the population pyramids to compare …
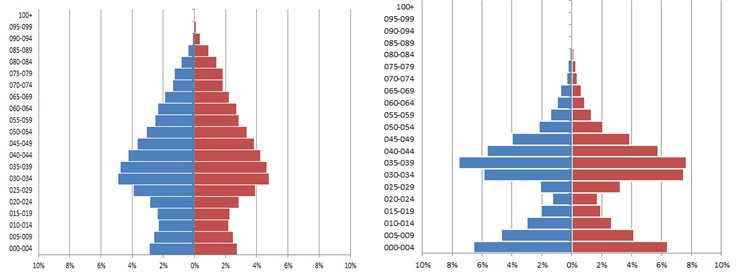
… and then place a pyramid on the other, so that we can measure and analyze population differences between them, ending the operation.
If we are managing two static populations, the task is more complex than solely fill the cells in the Excel sheet with the corresponding population figures, and prepare the pyramid-shaped chart that combines the values. However, suppose we have a population base or reference, belonging to all the individuals from a region, and we want to make comparisons between this amount and a classification of the subgroups in which this population can be divided, for example, the geographic or health care areas.
If the number of zones is very high, this will increase the amount of calculations and subgroups pyramids that we will need developing to compare with the main reference pyramid, increasing the complexity of demographic analysis to be performed.
At this point of the problem, PowerPivot enters the arena, because if we use to manage population data we must work with, greatly simplify the development of population pyramids and subsequent analysis phase.
Taking advantage of the pyramid developed in the items listed above, and reflected in the PiramidePoblacion.xlsx file, we will use that work setting as a starting point to develop, in first place, the population pyramids of different health areas, and continue with the reference pyramid creation, that depicts the Community of Madrid population.
The zoning pyramids
At first glance, this task may seem the most complicated, because its purpose is to create a pyramid for each one of the health area of the population we are dealing with.
Nothing is further from reality however, because if we followed the early commented articles about pyramids creation, we will have realized that we already have that work done in the PiramidePoblacion.xlsx file, created as an exercise of such of those articles, due to the use of a slicer based on the table Zona, from the PowerPivot data model.
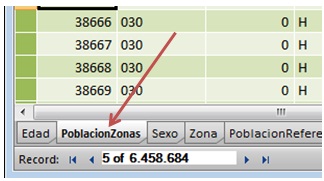
However, in order to reorganize the names we use in this article, we will remove the measures and pyramid chart we had originally created for the PivotTable. Also change in the window PowertPivot, the table name Poblacion to PoblacionZonas, by right-clicking on the tab for the table, and choosing the menu option «Rename».
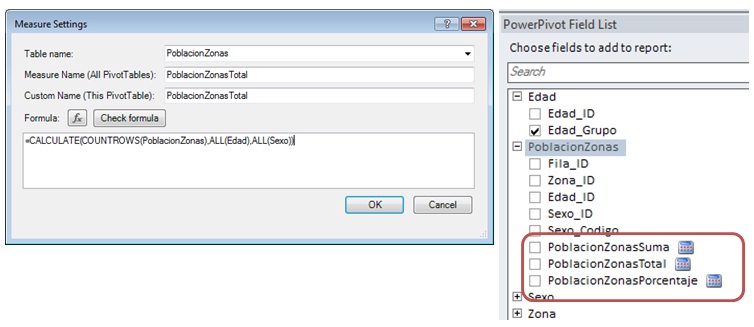
Next we will create again the measures for the PoblacionZonas table with the following names and expressions in DAX language.
PoblacionZonasSuma =
SUM ( [Sexo_Codigo] )


PoblacionZonasTotal =
CALCULATE ( COUNTROWS ( PoblacionZonas ), ALL ( Edad ), ALL ( Sexo ) )


PoblacionZonasPorcentaje =
[PoblacionZonasSuma] / [PoblacionZonasTotal]
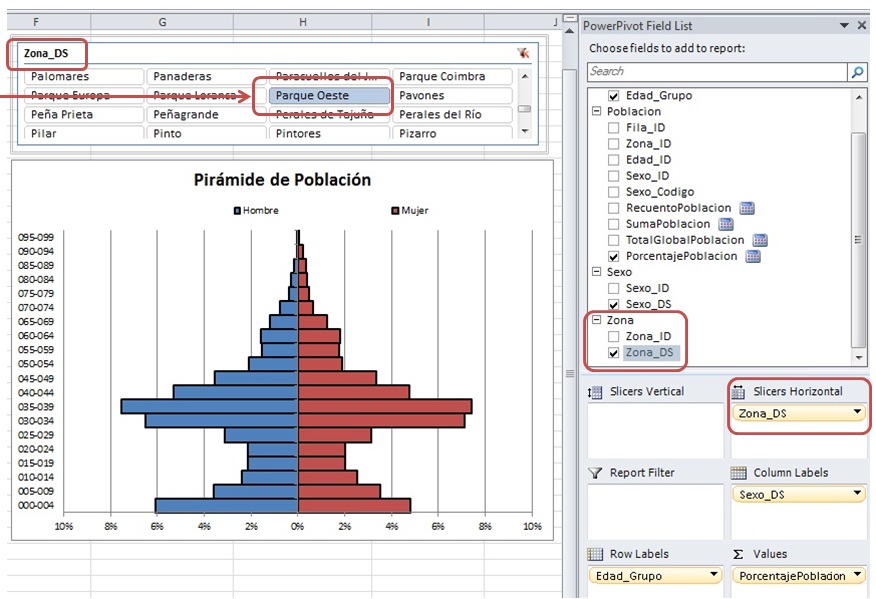
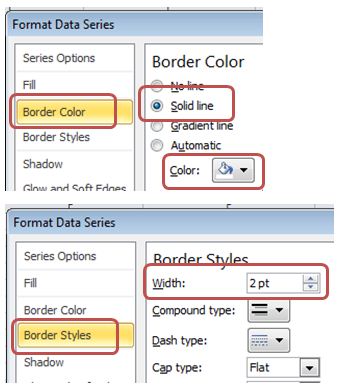
The way to create and configure the pyramid chart for these populations will be the same as in the articles already mentioned, except the edge of the bars, which in this case be assigned the color white, with a width of 2 points between thereof. Let’s recall that to format the bars will right click on any of them, selecting the menu option «Format Data Series».
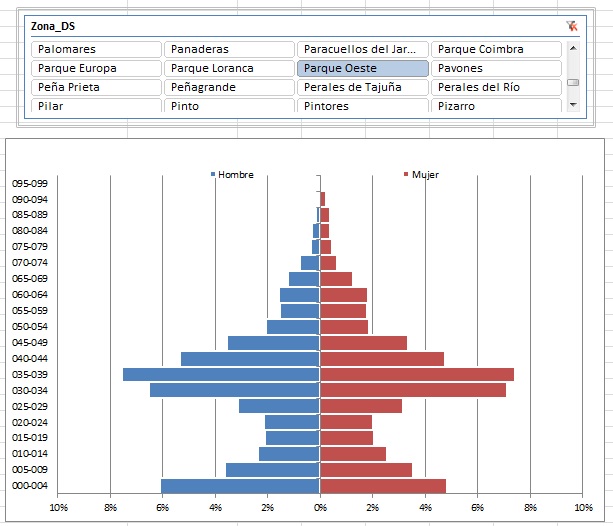
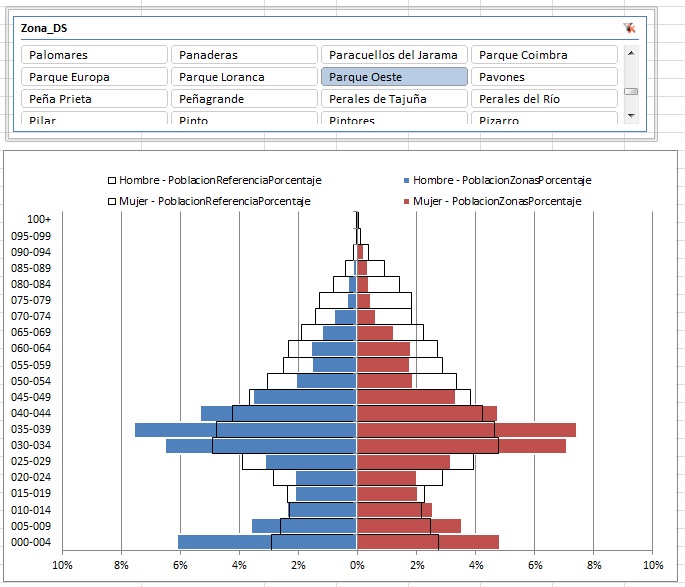
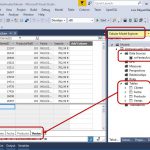
In the figure below we can see the chart with the changes just discussed (including the slicer by the field Zona_DS from Zona table), showing the pyramid from one of the available areas.
The reference population pyramid
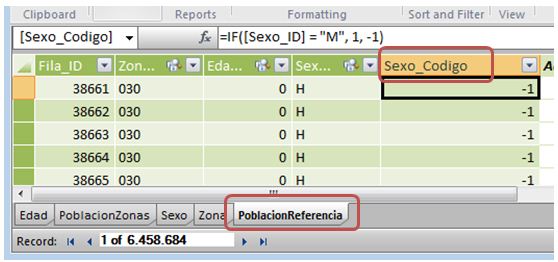
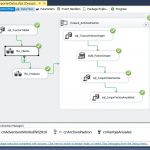
The next step is to add to the current chart the pyramid representing the total population, so we will place on the PowerPivot window, where we will repeat the process of adding the Poblacion table from source database to the PowerPivot data model, but this time giving the name PoblacionReferencia to the PowerPivot table, and also creating the calculated column Sexo_Codigo using the following DAX expression: «= IF ([Sexo_ID] =» M «, 1, -1)» cause we need to sum up the population according to sex of individuals.
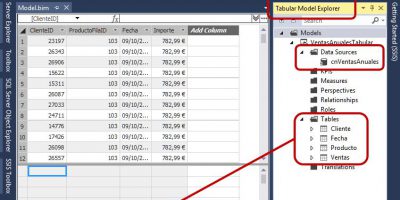
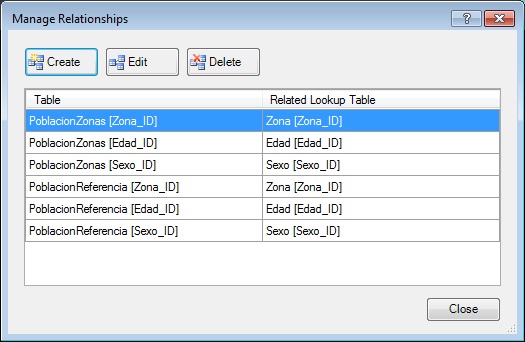
After this operation we will create the necessary relationships between both population tables and the rest, obtaining the result shown in the figure below.
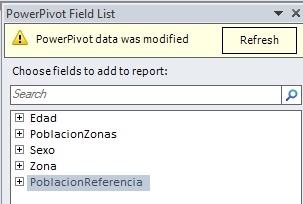
Then return to the Excel window, where we click the «Refresh» button in the «PowerPivot Field List» window to refresh its content, and incorporate the PoblacionReferencia table that we just added to the PowerPivot window.
With respect to the necessary measures to generate the pyramid corresponding to this reference population, the following code block shows the DAX expressions used for its creation.
PoblacionReferenciaSuma =
CALCULATE ( SUM ( [Sexo_Codigo] ), ALL ( Area ) )


PoblacionReferenciaTotal =
CALCULATE (
    COUNTROWS ( PoblacionReferencia ),
    ALL ( Edad ),
    ALL ( Sexo ),
    ALL ( Area )
)


PoblacionReferenciaPorcentaje =
[PoblacionReferenciaSuma] / [PoblacionReferenciaTotal]
Comparing the measures from the tables PoblacionReferencia and PoblacionZonas, we find in those a significant difference in the operations involved in sum and calculate the total population, consisting in the use of the ALL function applied to the Zona table, which is passed as parameter. Into the measure PoblacionReferenciaSuma we will use, furthermore, the CALCULATE function, so that the addition operation on the reference population table is carried out correctly.
The ALL function, when operating in a DAX expression used to construct a calculated measure that we use, for example, in a PivotTable, cancels those filters applied to the PivotTable, which are related to table passed as a parameter to the ALL function, and in our case, as mentioned above, affects the Zona table.
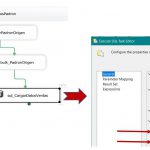
To verify this behavior, that will result in the pyramid of reference at the same time, in the PowerPivot fields window, drag the PoblacionReferenciaPorcentaje field to the Values pane. This will result in new columns insertion into the pivot table for the measure, and bars into the pyramid chart to represent the new population figures.
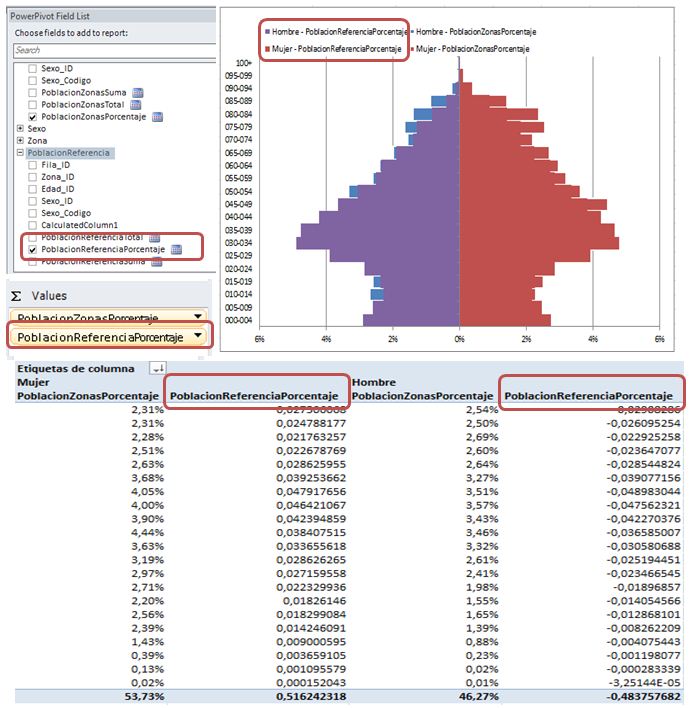
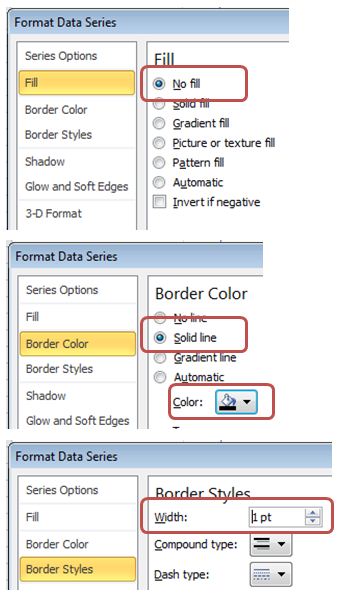
As a next step apply the percentage format to the new columns of figures from the PivotTable, and then do right click on one of the new bars from the population chart, selecting the «Format Data Series»; this action will open the window of the same name, where we modify the following properties / values.
– Filling: No Fill.
– Border Color: solid line, color black.
– Border Styles: width of 1 point.
Repeating the same operation on the other bar chart data will complete the visual configuration of the new reference population pyramid, which will stay superposed on the zone pyramid, thus achieving our goal. This result allows us to appreciate the differences between the two types of people, facilitating their analysis.
At this point we conclude this article about construction of population pyramids superposed using PowerPivot as a tool to model our data. In a future article will discuss the development of accumulated pyramids, a variety of population pyramid in which the pyramid bars provide more information, because they allow the inclusion of an additional category of classification.


Deja un comentario