A population pyramid is a tool that allows to analyze the status and evolution of a population based on age and sex. This is a feature in demography and statistics, but also cover areas such as health, education, business, etc. For this reason, its integration in an computing information system belonging to one of the areas just mentioned, involves a substantial enrichment in the quality of the results obtained by the users of such systems.
This article will discuss the construction of population pyramids using PowerPivot, an add-on to Excel 2010 that enables access to large volume data sources and its subsequent management and analysis.
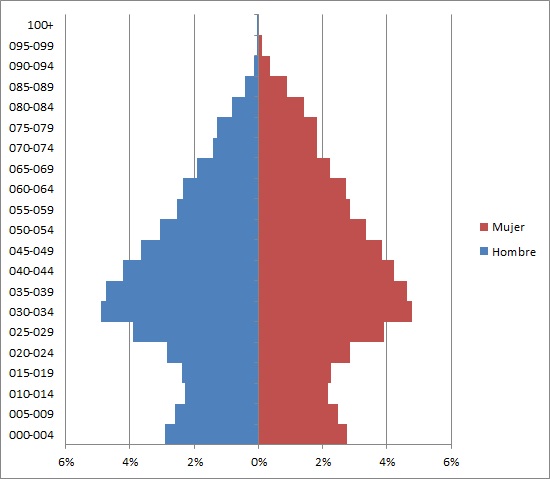
As we mentioned in the article Demographic data generation in SQL Server, also published in this blog, our current goal (using the PiramidePoblacion database created in that article) is to construct a chart representing a population pyramid similar to what we see in the figure below.
The first part of the article is devoted to the preparation of PowerPivot data model: connection to a data source, data load and pivot table creation to analyze the population figures. The second part will devote to the construction of the chart that represents the population pyramid, starting from the data on which we worked on the first delivery.
As in the previously mentioned article, I want to thank again the members of the Health and Studies Reports Service (Directorate of Health Promotion and Prevention, DG Primary Care, Health Ministry CM): Jenaro Astray Mochales, María Felicitas Dominguez Berjón, María Dolores Esteban Vasallo and especially to Ricard Gènova Maleras, for the support and guidance received on demographic concepts necessary to be able to properly develop a population pyramid using Excel 2010 in combination with PowerPivot. Besides all this, Ricard has kindly agreed to do a great job of reviewing this article, so the gratitude goes twice.
A little theory
But before to jump into its creation process, we will provide some brief theoretical notes on population pyramids that allow us to better understand their main features and the information we can collect and analyze from them.
In essence, a population pyramid is a double histogram that shows the distribution by age and sex of the individuals from a population, either in absolute figures or as percentage of the total population.
If we are interested in obtaining more detailed information about the conceptual aspects surrounding population pyramids, Epidat documentation can be useful. This is an software application developed by the Ministry of Health of the Xunta de Galicia and the Pan American Health Organization (OPS, Washington), from whose documentation, we quoted below some of the most important points concerning the issue at hand. First start with some ideas related to the construction of the pyramid.
«The best way to visualize the distribution by sex and age of a population is, without doubt, the population pyramid, a true icon of demography. A pyramid is a double histogram that allows, at a single glance, to draw up a clear idea not only about the general characteristics of the population (young, aged, with some imbalance by gender) but also specific features which refer to a particular event relative to the population under study.
Usually the population pyramids are constructed following several conventions and rules:
– To represent men at left and women at right of the central axis.
– Locating ages so as to be lower, the closer are the base and vice versa.
– Maintain a certain proportionality between the base and height (3 widths by 2 levels, or 4 by 3, approximately).
– Respect the same scale on both sides of the central axis (to facilitate comparison between sexes).
– Represent the weight of each age interval by the area of each histogram bar, not by its length, which is especially important when working with mixed age groups.
– Can be built with absolute values, but preferably with the proportions of each age and sex of the total population.
The last point is important and differentiates the pyramid structure indicators [proportion of young and old, aging index, etc.], which are calculated separately on the total for each respective sex. In the case of the population pyramid, using the total population of both sexes gathered, as the denominator of the proportions, not only ensures the comparability of age distribution, but also by sex.»
And we will conclude with those items relating to the pyramid’s interpretation.
«A pyramid by sex and age summarizes the demographic history of a population of at least a hundred years before the reference date (the time it takes roughly one generation to move from the base to the top of the pyramid). Sometimes, the indirect effect of some demographic events is visible beyond the leap of a century (for example, the impact of the sharp decline in fertility in recent decades experienced by many populations will be appreciated, no doubt, in the pyramids of the first half of the XXII). A simple ages pyramid [age by age: 0, 1, 2, 3 … 99, 100 …] allows a more accurate analysis than other age groups on aggregate (five-year, ten-year) but also suffers the risk of being affected by quality problems in the records, or be vulnerable to instability of the distributions in small populations.
The first perception of a pyramid allows to identify the general features of the represented population: a broad-based pyramid that narrows quickly gives an idea of a young population with a high proportion of children and adolescents, adults and elderly low, resulting of high birth and death. Conversely, a pyramid with a narrow profile at the bottom and wide at the top and the middle represents a mature or aged structure. The higher the life expectancy of a population is, most often the inequality by gender is reflected at the top of the pyramid (more full on the side of women, due to their highest level of survival).
The pyramid does not provide answers for itself, but conducive to the relevant questions arise. The explanations for their profile must be found in historical, social, political and economical events and tendencies that generate consequences in demographic future -that is, in fertility, mortality and migration, which are the phenomena that shape the contours and set the size of a population- and have an interpretation in terms of the triple time perspective: age, period and cohort.»
Incorporating data to PowerPivot
Thanks to VertiPaq, the PowerPivot’s data processing engine, we can achieve unprecedented power and speed in handling, filtering, creating expressions of business logic, and ultimately, in all the analytical operations that we perform on a data model created with this tool.
The following link provides access to PowerPivot’s web site, where we can download it, and then install it on our machine, so that we can follow the examples from this article.
When PowerPivot installation concludes, we will start Excel 2010, creating a new worksheet with the name PiramidePoblacion.xlsx. In the ribbon will have now a new tab with the name «PowerPivot». Clicking on it will select «PowerPivot Window » belonging to the «Launch» group, which opens the aforementioned PowerPivot window, where define the table structure we will use, or «data model» as referred in PowerPivot development context.
Then in PowerPivot’s window «Home» tab, we’ll connect to the database using «From Database | From SQL Server» option, from «Get External Data» group.
This will start the «Table Import Wizard», where indicate the data source we want to connect.
A valid data source to develop a population pyramid must have at least information about sex and age of the population, as is the case in PiramidePoblacion database. Additionally, as a way to enrich the analysis to be performed, the database may have additional information as may be the health zoning, population nationality and so on.
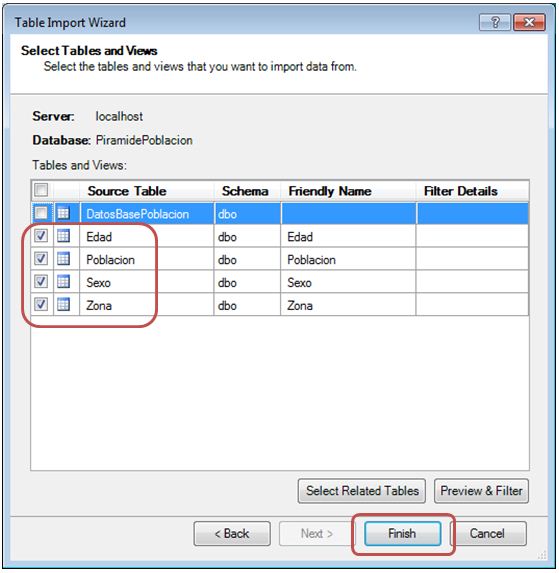
After selecting the PiramidePoblacion database, the next step will provide a list of tables and views that we could import, of which will mark the following: Edad, Poblacion, Sexo y Zona, beginning the import by clicking on «Finish».
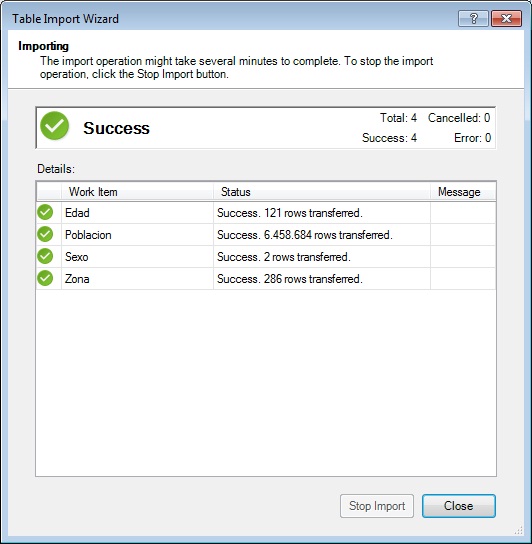
If the import process runs correctly, the wizard will display a summary of the process window.
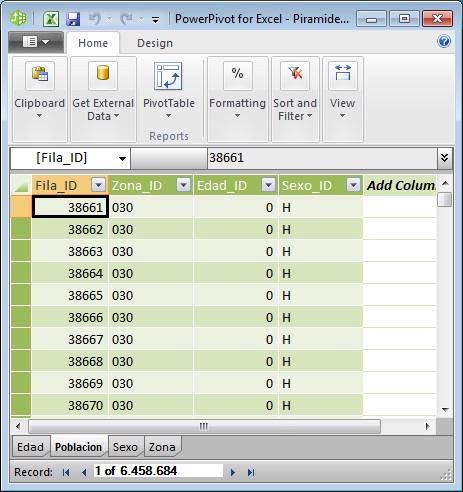
After the data entry concludes, we will click «Close» to return to the PowerPivot window, where we find the imported tables arranged in several tabs.
Analysis using PivotTable
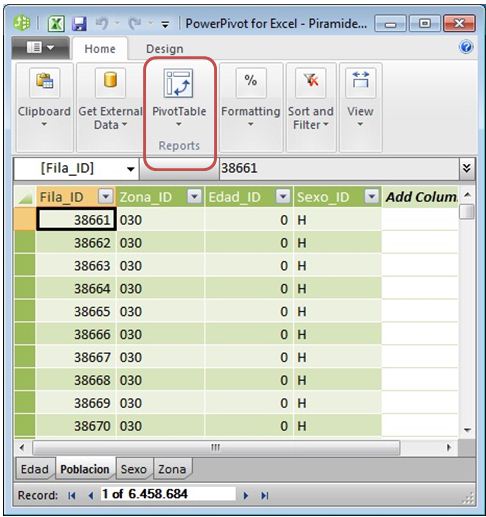
Before go back to the construction phase of the population pyramid, we will use a PivotTable to analyze the figures from the PowerPivot data model, so placed in its working window, we will click on «PivotTable» option, from «Reports» group.
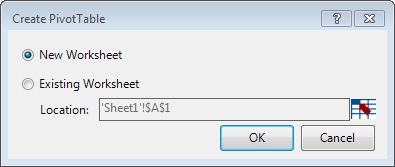
This will position us in the Excel window, which opens a dialog where we choose the worksheet that will accomodate the PivotTable.
In our case, selecting the first option and accepting the dialog box, will create the PivotTable on a new worksheet.
From the «PowerPivot Field List» panel we have at our disposal the fields from the data model tables, which will locate in different areas of the PivotTable (row labels, columns, values, etc.) to carry out our analysis operations. We will use for this a very similar style of work to that we would employ if we were querying an OLAP cube, since the management of the PowerPivot fields here is similar to what we can do with the dimensions and measures contained in a data cube when consulted from Excel.
Let’s start with a simple query, consisting in a record count of the Poblacion table, grouping the information by age group, which will place in the PivotTable rows.
We’ll make the record count through a DAX expression (the PowerPivot query language) located in a calculated measure, which will create by selecting «New Measure», belonging to the «Measures» group in the «PowerPivot» tab. We’ll apply this measure on the Poblacion table, so we must be previously positioned on it, within the field list panel.
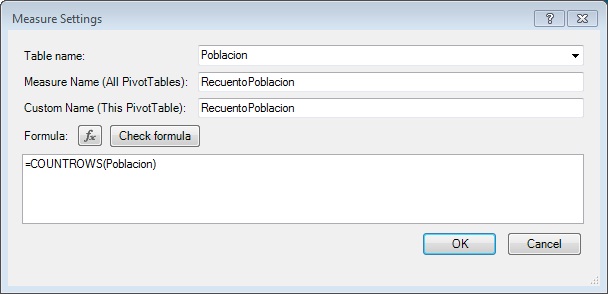
Selecting this option will open up the «Measure Settings» dialog, and in the formula text box we will write the following expression:
=
COUNTROWS ( Poblacion )
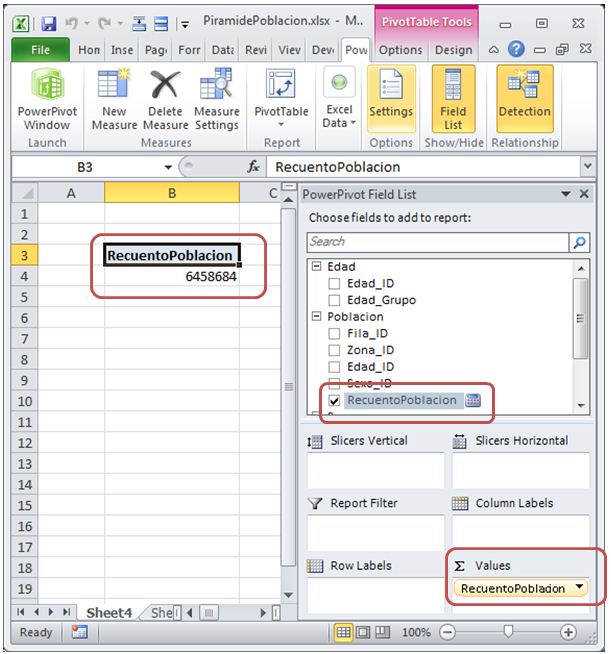
COUNTROWS, as its name suggests, is a function that counts the rows of the table passed as a parameter. To finish creating our measure, give it the name «RecuentoPoblacion» and click «OK».
Right after creating the measure, it is automatically added to Poblacion table field list and in the «Values» block, showing the table total number of rows in the pivot table.
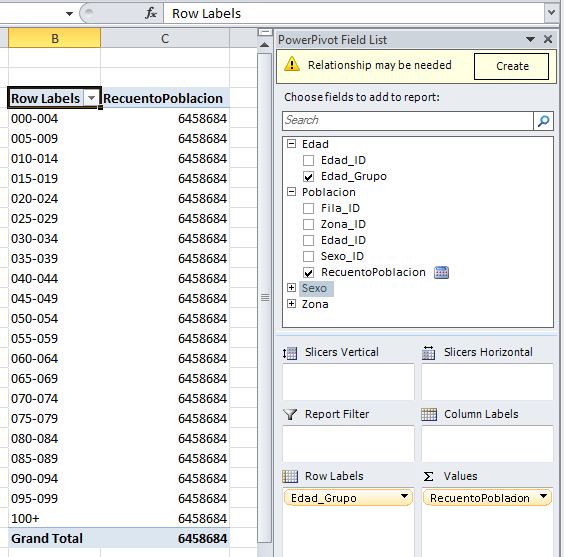
Then select in the field list pane, the Edad_Grupo field from Edad table, which automatically placed it in the block «Row Labels». If this is not the behavior obtained, we’ll manually drag the field and drop in that block.
As a result of the previous action the pivot table will be updated, showing the Edad_Grupo field values in the rows axis. Regarding figures from RecuentoPoblacion measure, they should be distributed among the sections of each age, to reflect the number of records (population) corresponding for each of these sections. However, as shown in the figure below, this is is not happening, because the measure shows the same value for all rows, which is incorrect.
Relationships between tables in the model
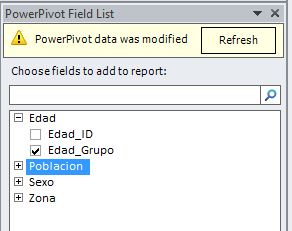
Observing the field panel we see that PowerPivot already noticed the problem just discussed, because on top of the panel displays a notice, which informs us that it may be necessary relationship between the tables that are being used to compose the pivot table query.
This problem would not have occurred if there had been the necessary relationships between tables in the database, but as we said in the article on the creation of the database population, such relations were not created intentionally in order to demonstrate that it is also possible do it so from PowerPivot, as discussed below.
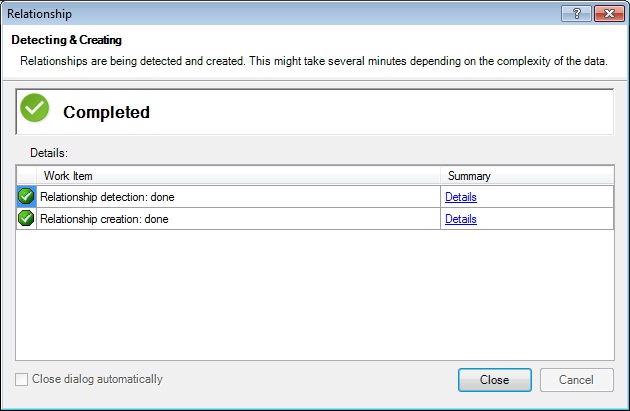
To let PowerPivot automatically detect the needed connection, we will click the «Create» button next to the notice displayed on the panel fields. As a result, a window will open to create the appropriate relationship, offering additional information on it through the «Details» links.
After relationship creation, it will be applied immediately on the pivot table without any user intervention, so it will properly display measure values grouped by age.
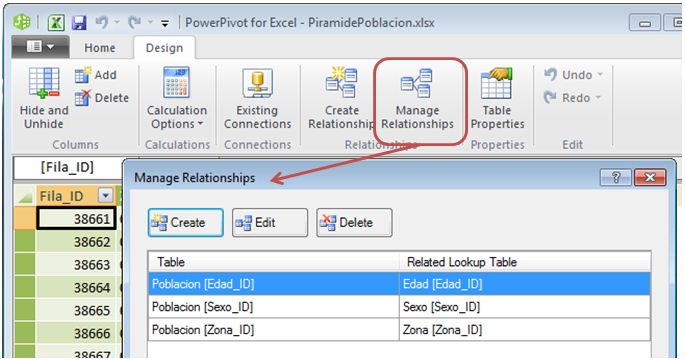
It’s also possible to manually create relationships between tables in the data model using the PowerPivot working window. To do this we will click the «Create Relationship» option, that belongs to the «Relationships» group, which is located in the «Design» tab of that window.
This will open a window which will select the table and column representing the source and destination of the relationship.
This way we will establish two new relationships, which have the Poblacion table as the source and Sexo and Zona tables as a destination. Additionally, using «Manage Relationships» we can see a summary of the relationships created and manage them (create, edit, delete, etc.).
These changes just make in the PowerPivot window may affect directly or indirectly the data we are presenting in the pivot table; for that reason, when we return to the Excel window, will see a notice on the field panel, where we click the «Refresh» button to update the data we’re working with.
Adding data to the column axis
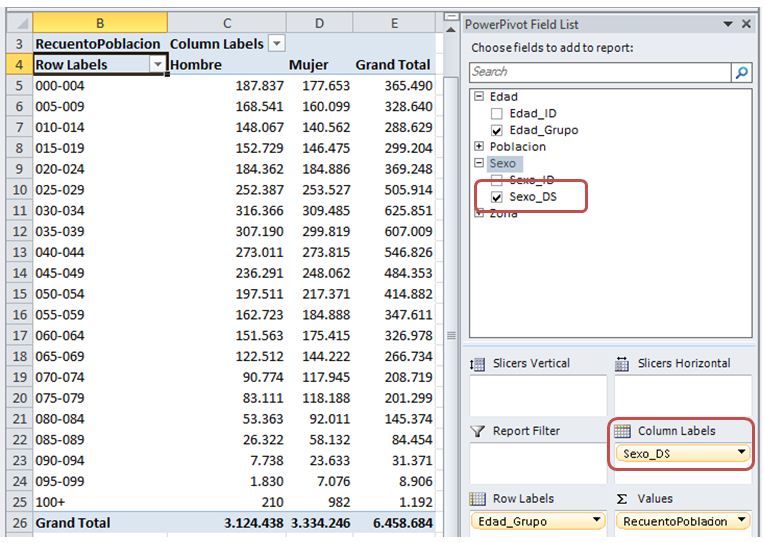
Fixed the relationships problem, now is time to add new data in the pivot table columns through Sexo_DS field from Sexo table.
When selected, this field is placed by default on the «Row Labels» blocks so we’ll have to manually move it to «Column Labels» block, or directly drag it to the label column block.
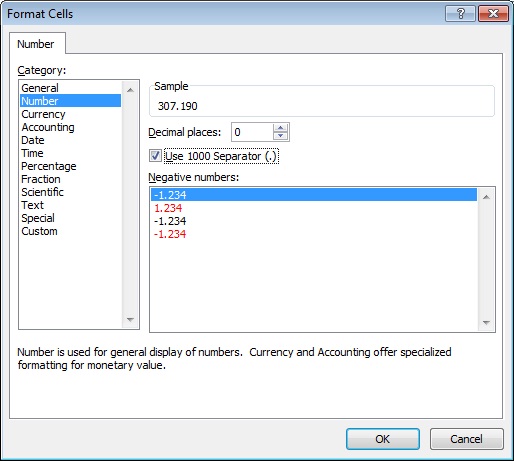
Additionally, we will format the numeric cells either by right-clicking any of them and selecting «Number Format» in the Format dialog box, where we’ll define it without decimal and with thousands separator.
After these operations, the PivotTable will already display population data according to the requirements posed.
Now we conclude the first part of this article. In the next installment we will reach our goal of creating a chart that represents the population pyramid using the data we have just prepared with PowerPivot.











anonymous
In the articles that were dedicated to the creation of a population pyramid using PowerPivot ( part1
anonymous
In the first part of this article we developed a data model in PowerPivot representing population figures
anonymous
This article addresses the challenge of develop a process to create a database with demographic information