Hi folks! I am really excited to finally be able to talk about one of the areas in which we have been working here at DNN Software over the last months. If you haven’t heard, some years back we started to deliver Evoq products (previously known as DotNetNuke Professional) as a Service. This is a cloud based Software as a Service solution called Evoq OnDemand, which runs on Microsoft Azure. We have been continuously evolving our solution, adapting to new Azure Platform changes and improvements such as improvements on Azure App Service, SQL Database v12, Azure Active Directory or Redis cache to name a few. We advantage our customers by leveraging new tools as they appear.

To share some numbers, we have already delivered more than 50,000 websites including Evoq trials and production environments, backed up around 400 terabytes of site information. While the log data size isn’t huge, managing 160GB of site logs per month is not easy from the operational point of view, especially when we need to troubleshoot performance issues on one of our customer properties and try to find the root cause.
When an incident happens, our DevOps team need to figure out in minutes what is the cause, and in a cloud connected world the problem sources grow at the same rhythm that new service offerings appear: is an underlying infrastructure issue? Is a recent DNN update the cause? Is a 3rd party module? Is a 3rd party connected service? We needed to add telemetry and instrumentation to every single part of our cloud infrastructure, and not only customer properties but also our backend automatic provisioning systems.
We have been covering our needs with NewRelic, successfully allowing us to dig into the problems and solving operational issues and, meanwhile, keeping an eye on Microsoft Application Insights’ evolution. Our monitoring needs kept growing, looking for aggregate views (i.e. how many websites are experiencing the issue we discovered on a customer log entry? How many websites are using this 3rd party module and experiencing performance issues?). So we continued trying other application insights tools like NewRelic Insights and Splunk for more advanced scenarios. And during Q4 last year we saw a demo of what Microsoft was doing in this field to improve the current Application Insights service. On the first demo we saw 70 terabytes of data filtered in almost real time, an advanced web tool for complex lightning fast queries, a desktop tool for multiple account aggregate queries, and the ability to consume the queries from a PowerBI dashboard. It sounded like the foundation of what we were looking for.
Preparing the Application Insights Analytics onboarding
As I mentioned before, our cloud infrastructure is not only serving customer websites or trials. Some years back I presented at Cloudburst our set of cloud services for tasks such as automated backup and restores, Evoq product updates, order processing and account management. These initial services continued growing over the years and we have now new services for pageviews calculation (Evoq OnDemand is available in page view tiers), IFilter index offloading for Azure App service environment and others for background tasks. We also have continuous integration implemented for the nightly builds of Evoq and DNN Platform being deployed on Azure App Service. Having the ability to automatically send the Application Insights information to the Analytics store was the next requirement.
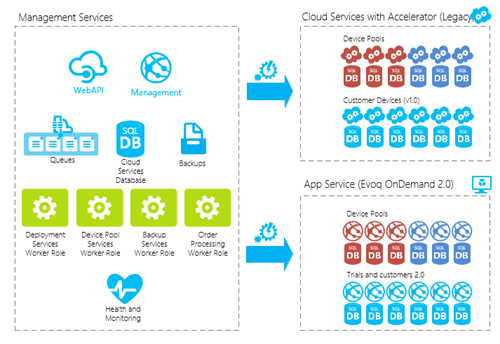
The easiest path to have all the data available on Application Insights Analytics was to instrument each cloud service and website with Application Insights to start sending all the telemetry data. Once on Application Insights, all the information would be available for querying from Analytics using AQL (Analytics Query Language). So we finally worked on two areas:
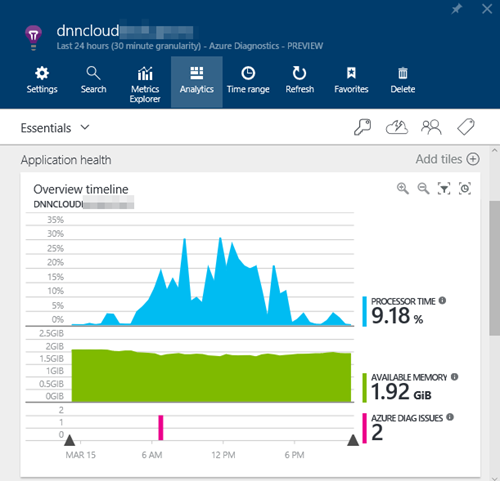
1) Modifying all the worker roles (cloud services) to start sending the telemetry data to Application Insights. During the Connect(); event last year the Azure Diagnostics integration with Application Insights was announced, available with the Azure SDK 2.8. This was really easy to implement just by following the steps mentioned on the blog post and deploying a new version of each worker. In just a few minutes we started to have all the telemetry available on the Azure Portal. Kudos to the team for making this so easy;
2) Create a new Application Insights monitoring provider to automate the Application Insights account provisioning and deployment on each website under our control. When we initially designed our backend monitoring services, we implemented a “monitoring provider” approach starting with Pingdom and NewRelic implementations. A monitoring provider is just an integration point in our platform, that supports methods like “install, uninstall, pause and resume monitoring” helping us, for example, to pause all the alerts on a website during maintenance or update operations. Our internal Application Insights monitoring provider implements this interface, automatically provisioning the account and alerts as well as pushing a web deploy package using the Resource Manager API. We can also run these operations manually by using our backend systems, through a web UI or by using our custom PowerShell cmdlets to provision and configure hundreds of Application Insights accounts with just a few lines of code:

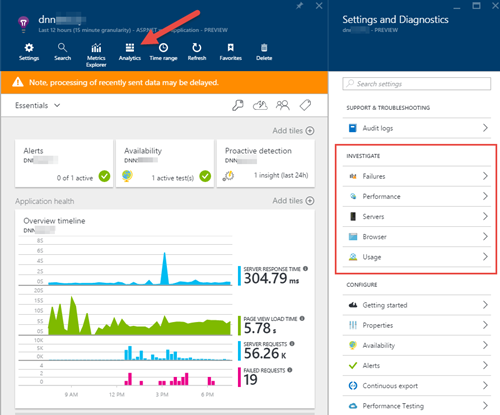
We can then visit the Azure Portal and check what is going on with each website or service and find performance issues and what is causing them: if the problem is on server side, a dependency, or is just a new skin that the customer has applied to the website that is performing badly as we can see in the graph below where the server response was consistent but the Page Load time skewed upwards, indicating client-side problems.
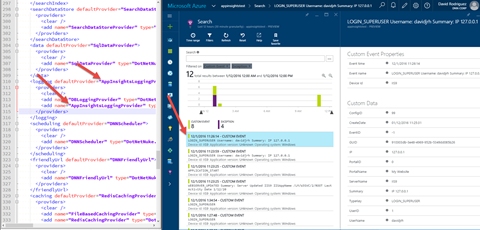
For every single web application, we are able to search not only by page views, requests, traces or exceptions. Since we have implemented a custom logger for DNN, we are able to search by DNN Eventlog records or the typical log4net data being stored under /portals/_default/logs. We finally have one place where we can query for all the parameters.
Advanced search using Application Insights Analytics
And once we have all the telemetry data sent to Application Insights, is now when we can start running advanced queries by using the new Analytics feature.
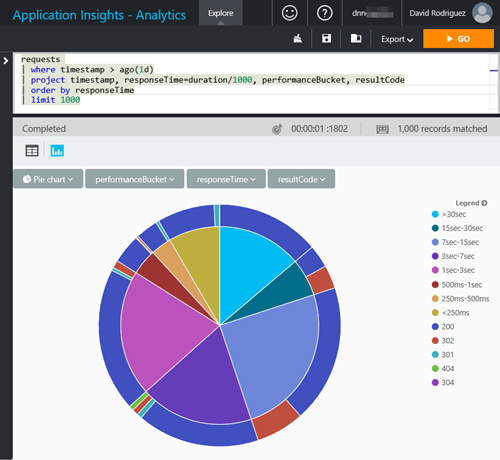
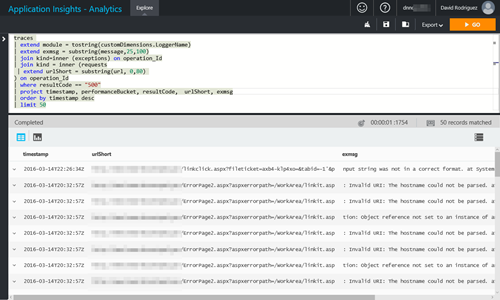
Application Insights Analytics is a powerful query engine for your Application Insights telemetry that uses a query language named AQL. The language instead of nesting statements like in SQL, allows to pipe the data from one elementary operation to the next. We can filter all the raw telemetry data sent from each website by any field including DNN Eventlog records, execute statistical aggregations and immediately show the raw text results or with powerful visualizations.
As part of our automatic Application Insights provisioning, we create alerts for each resource being monitored. When we receive an alert we start using the tool to start digging into the problems to find patterns by using AQL. The UI allow us to save predefined queries and load them for later use.
Side Benefits of Machine Learning running on background: Proactive Detection
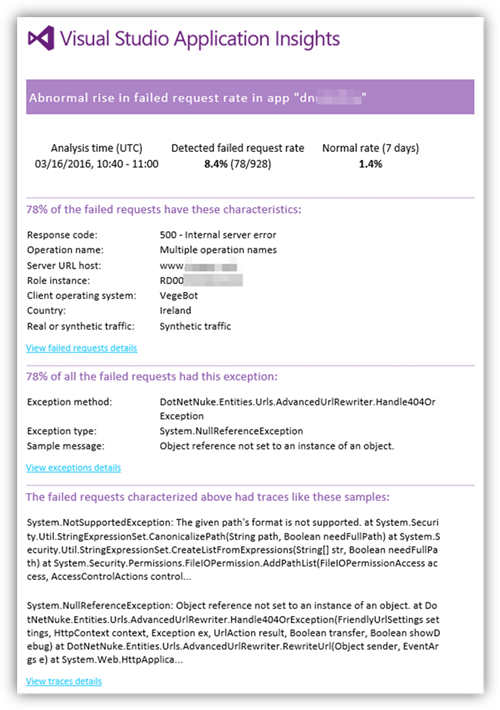
One thing that is amazing and is getting better day by day, is the Application Insights Proactive Detection. This feature notifies you about potential performance problems in your app, by using “Near Real Time Proactive Diagnostics”. What you get are alerts on abnormal rise in the failed request rate, and no configuration is required! It just works.
As example, check this alert we received today. I was shocked on the information provided by the service and how fast we go to the root of a problem.
On this case was a bot requesting bad formatted URLs and causing an abnormal rise in failed request rate. We detected the problem thanks to the stack trace provided on the alert that arrived 15 minutes after the proactive analysis, found the problem, created a patch and problem gone.
Do you love it? Me too!
Application Insights module for DNN Platform
If you also have a DNN based website and want to get started with Application Insights and Analytics I have published on GitHub an open source module that allows to start sending all your website telemetry to Application Insights: pageviews, web requests, trace information (log4net log file contents), exceptions (including client side browser exceptions) and DNN Eventlog records.
Getting Started
The module is a DNN Platorm extension to integrate Visual Studio Application Insights to monitor your DNN installation. To setup the module on your installation, follow these steps:
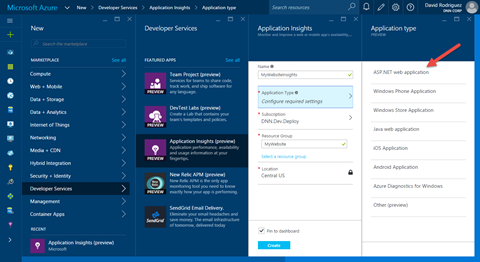
1. Provision a new Application Insights service following the guide at https://azure.microsoft.com/en-us/documentation/articles/app-insights-overview/ Ensure you choose «ASP.net web application» on the «Application Type» parameter
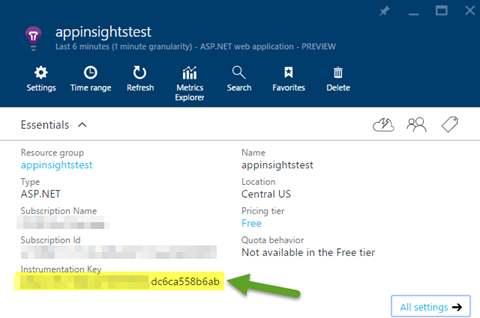
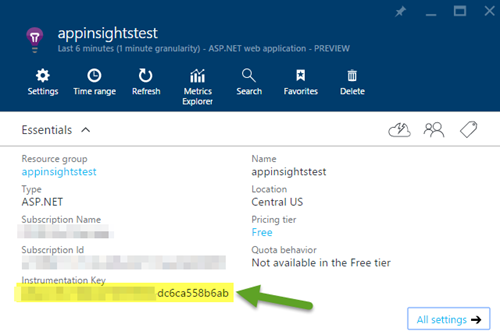
2. Once provisioned, copy the «Instrumentation Key» available on the resource Essentials properties
3. Now from the Releases folder https://github.com/davidjrh/dnn.appinsights/tree/master/Releases download the latest module package version ending on «…Install.zip» (the Source.zip package contains the source code that is not needed for production websites).
4. Install the extension package in your DNN instance from the «Host>Extensions» menu like any other module
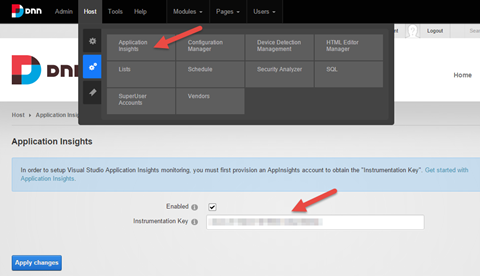
5. Once installed, a new menu under «Host (Advanced menu)>Application Insights» will allow you to paste the instrumentation key obtained on step 2. After applying the changes, you will start receiving data on Application Insights after a few minutes.

Un saludo and happy coding!

