Obviously, debugging an already deployed application, doesn’t matter if Azure or any other environment, is something we must use as a last resort, I would always prefer to be able to reproduce some kind of situation with a local test and correct it. But sometimes we would need to debug an already deployed application, and it is never as easy as click F5 in our Visual Studio. We must connect to remote processes, make sure we have the right version of the code, and more important, be able to match the binaries with the code we have, because surely you always build your applications as Release to deploy them (and if not … run, run and do it).
Having the right version of the application is easy we have branches, tags, and other tools which allows us to locate the right code version. Attach to remote processes is something maybe a little bit more complex, but fortunately we have Remote Debugging tools, and even more, in Azure Web Apps, we can directly enable it from Visual Studio or the portal, and connect automatically, we will see this later.
To make sure we match the binaries with the code we have symbols, but we need to have the right symbols for the binaries, something we can get via a Symbol Server, this is something you can setup by yourself, but luckily now we have a Symbol Server included in VSTS, well it is still in preview mode, but it is something rather interesting to setup and worth it. Let’s start on how to set it up.
Disclaimer: I’m not digging into how to create a build definition, or deploy an application to Azure Web App using Release Management, so if you are not familiar with this kind of tasks first make familiar with these, or just leave me a comment if you find it interesting for next blog posts.
Disclaimer II: You will need Visual Studio 2017 updated to the last update for doing this.
Enabling the feature
As a preview feature, we must first turn it on for our account, or ask something with the needed privileges to turn it on, we just click on the top right, in our account icon, select Preview features and enabled it for the account.
But in this case, this is not a stand-alone feature, this feature needs the Package Management extension from the Visual Studio Marketplace, which, remember, is not free, but the symbol server added to the package management extension is worth the price.
Publishing symbols
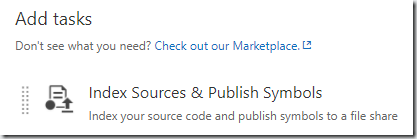
Once set-up the account we can start publishing our symbols. Usually (if not … again … run) we have one build, n deployments. So this is something we are doing during the build. So let’s go to edit the build definition used to generate artifacts for deploy, and add a new step after the build step, and add the publish symbols task.
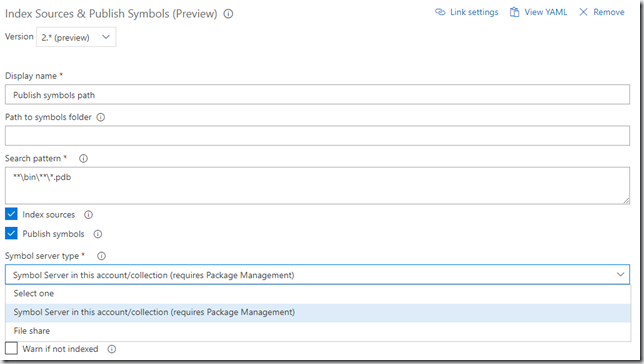
By default, when adding the task, it is added with the version 1.*, but we will select version 2.* (preview) version of the task, and in the Symbol server type parameter, we select Symbol server in this account … I will remind you the need of Package Management extension.
This is the only change we need to do in our build or releases. So let’s go to next step.
Configuring Visual Studio to consume VSTS Symbol Server
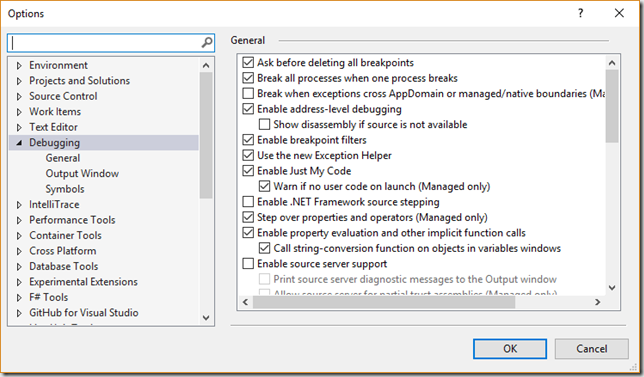
We must configure Visual Studio for a couple of things: instruct it to debug using symbol servers, which symbol servers to use. We will do both of them from the Tools / Options screen.
For the first one we go to Debugging section of tools, and disable Enable just my code, yes, disable it, so Visual Studio is instructed to debug external code.
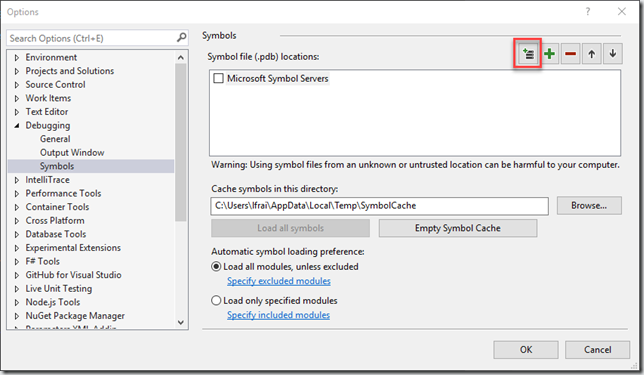
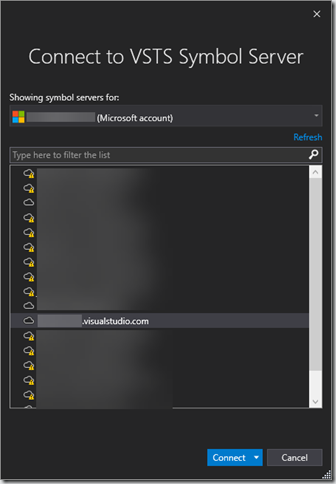
Now under Debugging / Symbols, click on the icon I show you in the next picture, which will bring the add new Symbol Server from VSTS. You can leave the rest of the parameters with the default values.
On the next screen just select the VSTS account in which you set-up the symbol server. And after that close the Options screen.
Debugging the Azure Web App
If we came this far, we have everything ready to start debugging, so with the version of the code we published the symbols and deployed open into Visual Studio, we will attach to the Web App process for debugging. Be sure to enable the breakpoints you need for the debugging and also notice you will impact any user of the application so better do it in a slot or any environment with no real users.
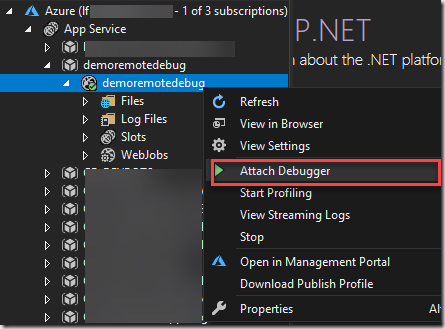
On Visual Studio 2017 Server Explorer, make sure you are connected to the Azure Subscription, and in the App Service list, locate the resource group containing your app, locate the app (and the slot if you have it), right click it, and select Attach debugger.
This can take a while, but after finish the attach, it will automatically connect to the Symbol Server, get the debug Symbols and you are ready to go and start debugging your web app with the breakpoints and the debugging features of Visual Studio and Azure.
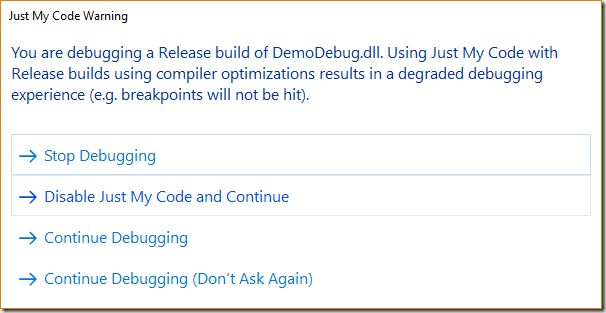
If you receive an alert like this.
Remember to disable the Enable Just my code mentioned earlier in this same post.
Keep it clean
After debugging, this is something I like to do, and is go to the Azure Web App Application Settings, and disable the remote debugging check. Next time you need to debug, following previous steps, Visual Studio will re-enable it for you, but I just like to keep it off … just for the case …
Hope you enjoyed this feature as much as I do.
